Quantitative and Qualitative Correlation and Deviation Analysis
of the National Weather Service Weather Station (Newport Municipal Airport)
with Several Weather Underground Weather Stations
Authored by Rick Hallowell
Date: 5-Sep-2020
Prior to 1 July 2020, the temperatures observed at the National Weather Service1 (NWS) weather station at the Newport Municipal Airport2 (ONP) appeared to widely fluctuate and deviate with temperatures observed at my home weather station. I undertook a detailed quantitative analysis of the NWS station. There are several Weather Underground3 (WU) personal weather stations in close proximity to the NWS station. From 1-Jul-2020 until 31-Aug-2020, I collected and compiled data from the NWS and WU weather stations from which I developed a series of charts to show that the temperature probe at the NWS station was indeed failing.
During the data collection period, the NWS station was repaired. This afforded me the opportunity to assess the correlation and deviation performance of the WU stations with the NWS station. I had at first assumed that the WU stations would correlate very closely to the NWS station. But after a detailed analysis, it was shown that although the WU stations “trend” each other, they do not correlate with each other. Some stations read above the NWS readings, some read below and others (and a various times) read nearly the same as the NWS station.
Conclusion: Even though the WU stations are geographically close, each station’s geospatial location and other environmental factors showed that although the WU stations tracked the NWS station’s trend, the correlation was not that tight. Each station’s (NWS and WU) temperature recordings are relevant only unto itself.
-----------------------------------------------------------------------
What follows is an overview of the stations; data collection method; and various charts and analyses. This report is available here as a PDF file. Please feel free to further distribute. If there are any questions, comments, corrections, and assumptions, I can be contacted at hallowellra@gmail.com.
Overview:
The National Weather Service by its mission statement is to “Provide weather, water, and climate data, forecasts and warnings for the protection of life and property and enhancement of the national economy.” When weather stations are located at or near airports, NWS provides valuable and essential weather data vital to airport and aviation operations. The Weather Underground provides local and long-range weather forecasts, weather reports, maps and weather conditions for locations worldwide. The WU utilizes an internet connected network of citizen-scientists sending real-time data from their own personal weather stations to a centralized server. Around the Newport Airport are several WU stations identified as KOROREGON54, KORSOUTH3, KORSOUTH6 and KORSOUTH9.
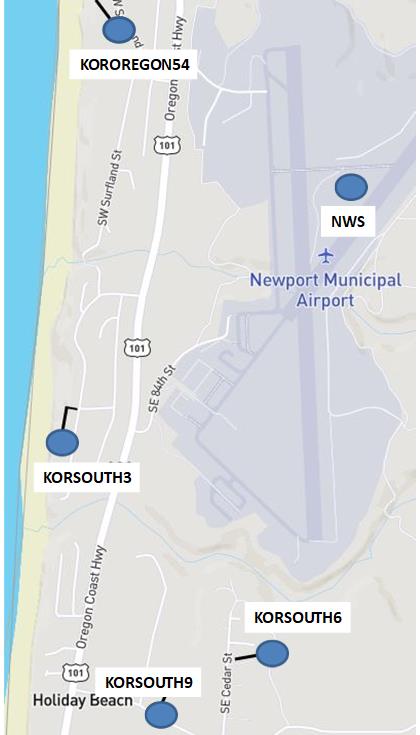
Weather Stations: (See Map in References and Links section4)
NWS: The NWS station is located at the Newport Municipal Airport (ONP) and is operated by the Newport Airport Authority. The station is a Vaisala5 Automated Weather Observing System (AWOS) Models VC & VD using a DTS12A series temperature probe. The stated accuracy is ±0.08 °C at 0 °C. The sensors are located on an open field with no surrounding trees or barriers. The official stated height for the airport is 161 feet above mean sea level (AMSL).
KOROREGON54: This is a Davis Instruments Vantage Vue6. The stated accuracy is ±0.5°F. It is located NW of the NWS station around SW Surfland and SW 73rd and is surrounded by trees except for the back of the house which overlooks the beach. The distance to the NWS station is approximately 0.6 miles. The sensors are mounted on a pole at the side of the house. The height of the station (ground height plus height above ground) is approximately 145 feet.
KORSOUTH3: This is a Davis Instruments Vantage Pro27. The stated accuracy is ±0.5°F. It is located SW of the NWS station around SW Marine Drive View and SW 86th Court and is at the top of the cliff overlooking the beach. The distance to the NWS station is approximately 0.9 miles. There are no surrounding trees or barriers. The sensors are mounted on a pole at the back of the house. The height of the station (ground height plus height above ground) is approximately 75 feet.
KORSOUTH6: This is an Ambient Weather WS-20008. The stated accuracy is ± 2°F. It is located south of the NWS station (near the end of runway 16) around SE Cedar and SE 95th Court and is surrounded by trees and a north facing hillside. The distance to the NWS station is approximately 1.1 miles. The sensors are mounted near the top of a shingled roof. The height of the station (ground height plus height above ground) is approximately 170 feet.
KORSOUTH9: This is a Davis Instruments Vantage Vue. The stated accuracy is ±0.5°F. It is located SSW of the NWS station around SE Birch and SE 98th St in an open yard is surrounded by nearby, but not close, trees. The distance to the NWS station is approximately 1.3 miles. The sensors are mounted on a pole in the middle of the open yard. The height of the station (ground height plus height above ground) is approximately 125 feet.
Data Collection and Distillation:
Each station posts data to the internet9. The approach was to gather daily data from each station, compile, distill and display in graphical presentations. The daily raw data is actually a multitude of measurements that include temperature, dew point, relative humidity, wind, rain, etc. From the raw data, the temperature measurements for each station are extracted. For all five stations, a total of 73,438 raw data points were collected.
The time duration of measurement for the NWS data is different than the WU stations. That is, NWS duration is around 20 minutes whereas the WU duration is around 5 minutes. A time point of 15 minutes past each hour was chosen since all stations post a measurement at that time point ±5 minutes. From the daily data, an hourly data point was distilled from each day’s recordings. The hourly database served as the master data set. From the master data set, several subsets and charts were generated. One subset was a distillation of the hourly data points to a daily quadrant data set (that is, temperatures recorded at 12:15am, 6:15am, 12:15pm, and 6:15pm). The idea behind the quadrant sets is that at different times of the day, the sun angle and the station’s environmental factors could affect the station’s sensor performance.
Charts and Analysis:
The NWS weather site reports its temperature readings in whole numbers (e.g. 65 °F) whereas the WU stations report their readings to the first decimal point (e.g. 65.5 °F). Since the NWS readings are to two significant digits, I rounded the WU stations readings to show whole numbers and two significant digits of resolution.
There are two sections of charts and analyses. The first section is the preliminary analyses which cover the period from 1-Jul-2020 until 31-Aug-2020. I also made use of the WU “average” concept which provided a general correlation and reference to the NWS station but what only useful for a qualitative analysis. The second section is the detailed analyses of the individual WU station against the NWS station. In that section, the NWS station is used as a reference to the WU stations.
The date range has been reduced to 29-Jul-2020 until 31-Aug-2020 covering the period where the NWS station returned to reporting “normal” temperatures. At first I lamented that I had chosen August to record temperatures as there were extreme variations throughout the month. In hindsight, this proved to be useful to show the effect of location and environmental factors amongst the stations. This analysis will be shown in a special chart at the end of the detailed analyses.
For all charts the vertical axis is the temperature range and the horizontal axis is the date range. Since multiple data points occur with a single day on some charts, the horizontal axis is plotted as points rather than dates.
Gaps in the plot lines are indicative of missing or incomplete data.
Preliminary Analyses:
This chart plots all the hourly data for all the weather stations from 1-Jul-2020 until 31-Aug-2020.
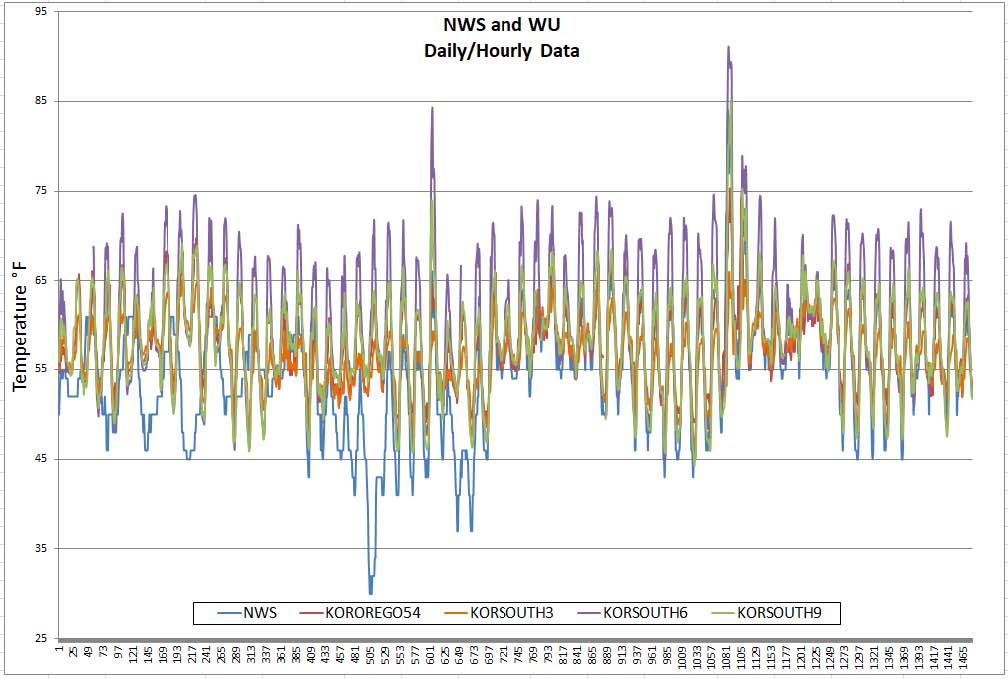
This is obviously a very “busy” chart and not much quantitative analysis can be performed. However, from a qualitative viewpoint is does show that prior to 29-Jul (point 682 - assumed date of NWS repair), the NWS temperature sensor was acting erratically.
In an attempt to declutter the data, I took an hourly average reading of the four WU stations and plotted against the NWS readings.
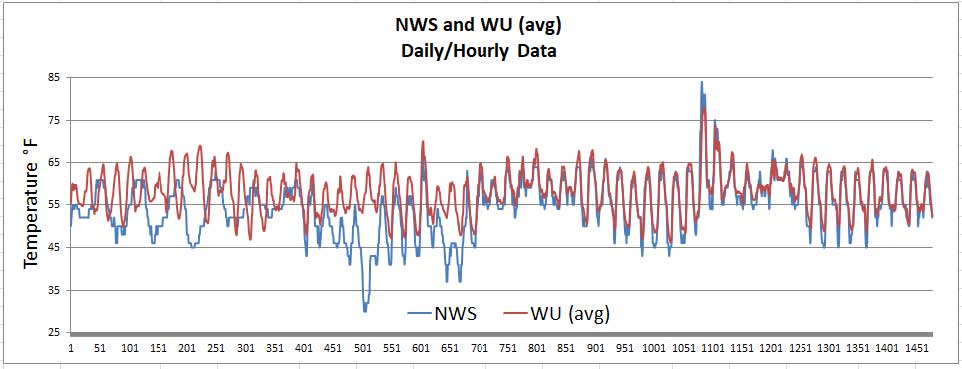
Again, from a qualitative viewpoint is does show that prior to 29-Jul, the NWS temperature sensor was failing.
I reduced the data sets even further to plot a daily temperature average for each station and further averaged the WU stations into one plot line against the NWS average plot line.
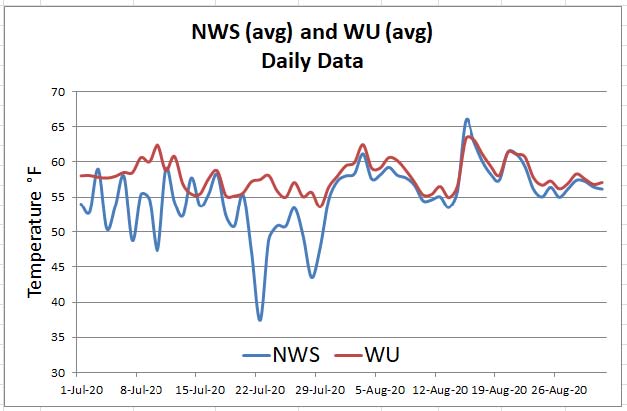
This is another view showing sensor failure.
Detailed Analyses:
Each WU station is presented with its own set of common charts to evaluate performance with the NWS station as a reference.
The horizontal axis is the date range from 29-Jul-2020 to 31-Aug-2020. Again, since multiple data points occur with a single day on some charts, the horizontal axis is plotted as points rather than dates.
KOROREGON54:
The following is a plot of the hourly data for each day.
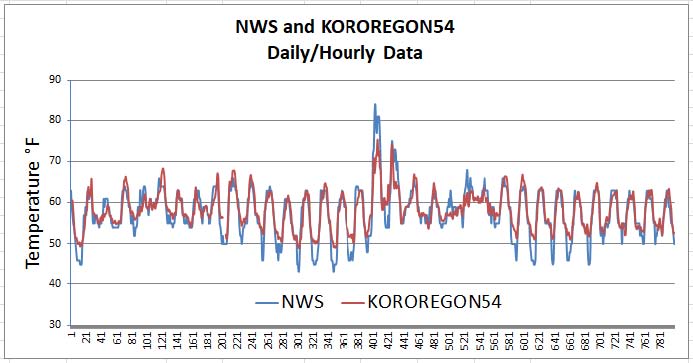
During this date range there was a 1°F average difference between the KOROREGON54 station and the NWS station after the repair along with a 7°F maximum positive difference and a -15°F maximum negative difference.
|
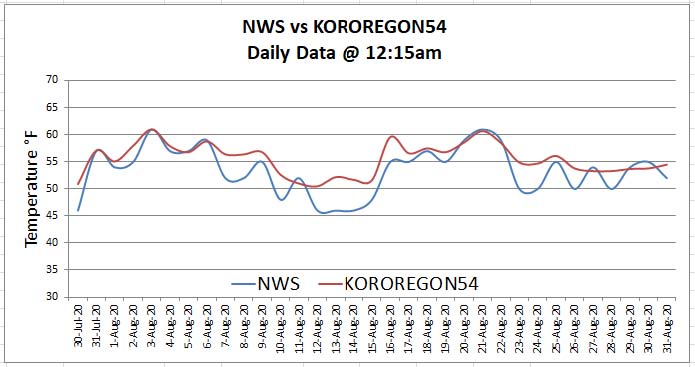
For the 12:15am quadrant, there was a 2°F average difference between KOROREGON54 and NWS along with a 6°F maximum positive difference and a -1°F maximum negative difference.
|
|
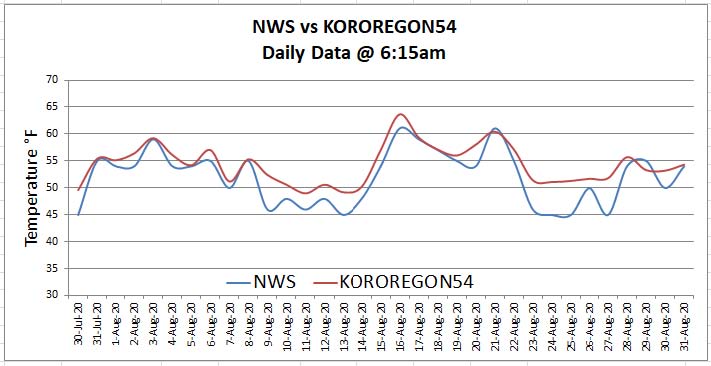
For the 6:15am quadrant, there was a 2°F average difference between KOROREGON54 and NWS along with a 7°F maximum positive difference and a -2°F maximum negative difference.
|
|
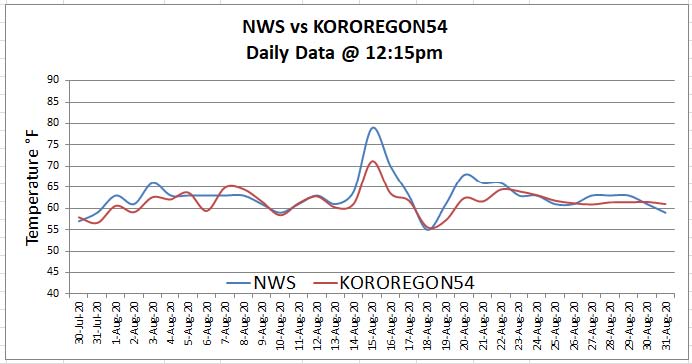
For the 12:15pm quadrant, there was a -1°F average difference between KOROREGON54 and NWS along with a 2°F maximum positive difference and a -8°F maximum negative difference.
|
|
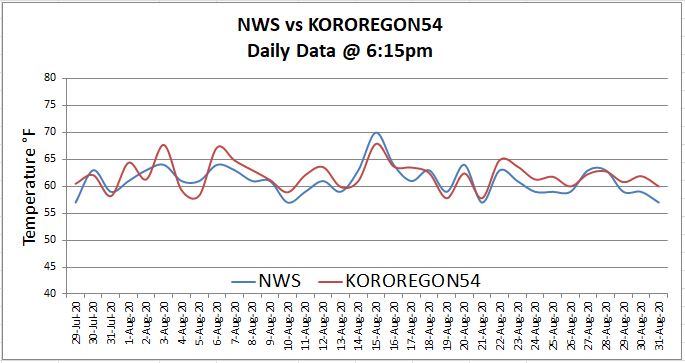
For the 6:15pm quadrant, there was a 1°F average difference between KOROREGON54 and NWS along with a 4°F maximum positive difference and a -3°F maximum negative difference.
|
KORSOUTH3:
The following is a plot of the hourly data for each day.
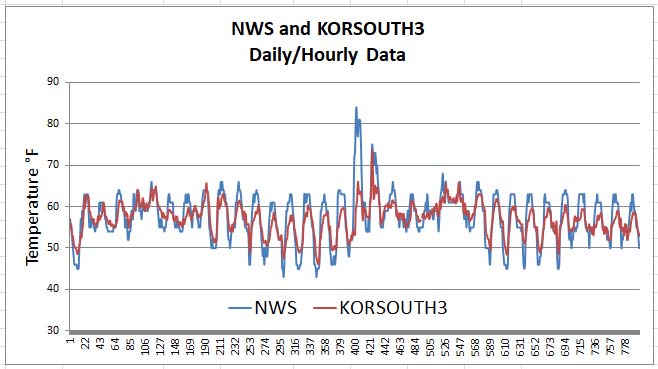
During this date range there was a 0°F average difference between the KORSOUTH3 station and the NWS station after the repair along with a 7°F maximum positive difference and a -24°F maximum negative difference.
|
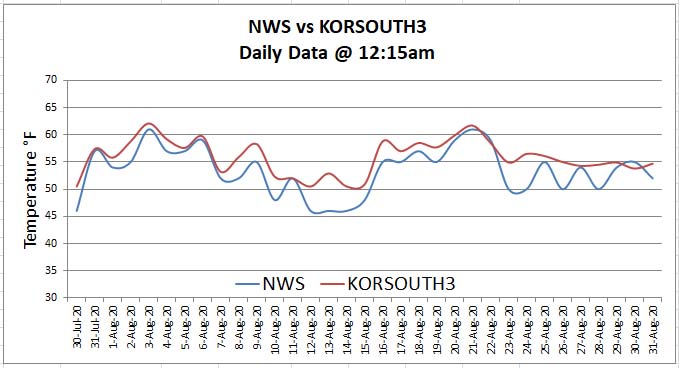
For the 12:15am quadrant, there was a 2°F average difference between KORSOUTH3 and NWS along with a 7°F maximum positive difference and a -1°F maximum negative difference.
|
|
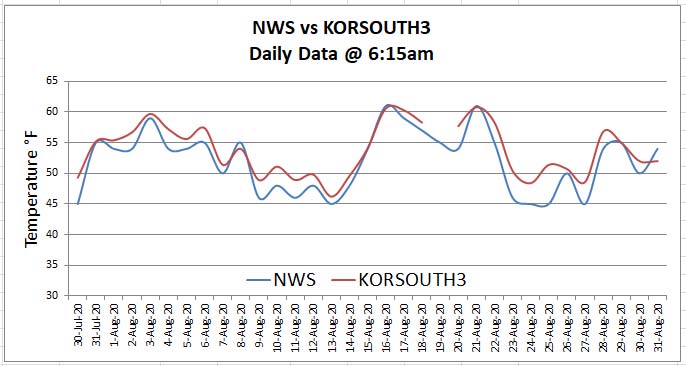
For the 6:15am quadrant, there was a 2°F average difference between KORSOUTH3 and NWS along with a 6°F maximum positive difference and a F maximum negative difference.
|
|
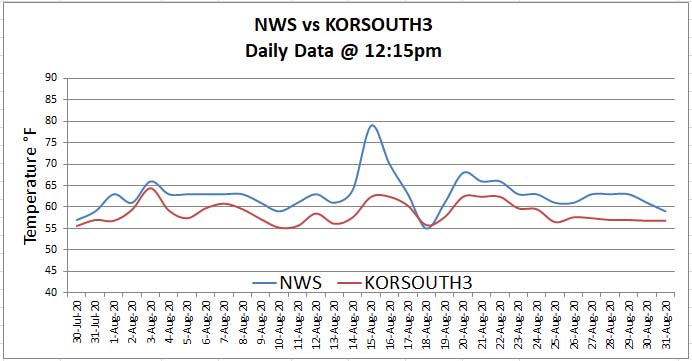
For the 12:15pm quadrant, there was a -4°F average difference between KORSOUTH3 and NWS along with a 1°F maximum positive difference and a -17°F maximum negative difference.
|
|
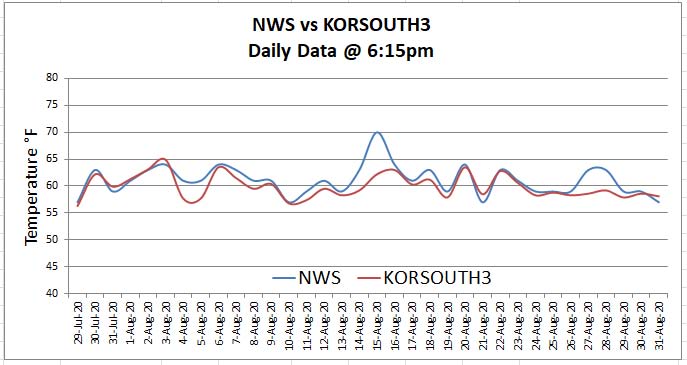
For the 6:15pm quadrant, there was a -1°F average difference between KORSOUTH3 and NWS along with a 2°F maximum positive difference and a -8°F maximum negative difference.
|
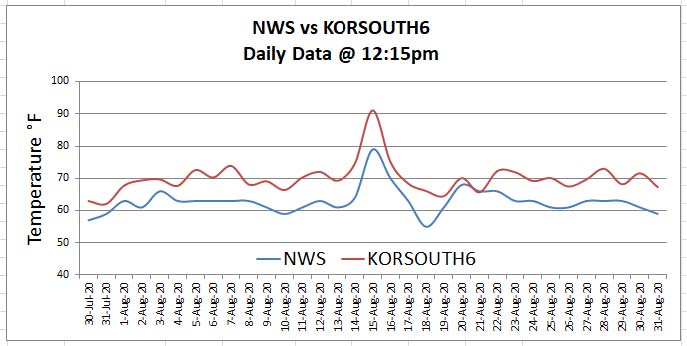
KORSOUTH6:
The following is a plot of the hourly data for each day.
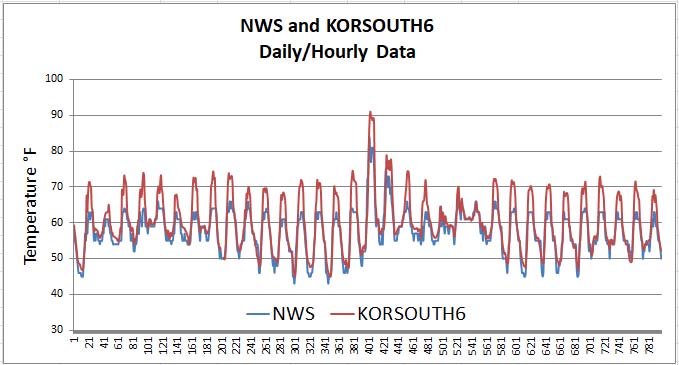
During this date range there was a 3°F average difference between the KORSOUTH6 station and the NWS station after the repair along with a 13°F maximum positive difference and a -9°F maximum negative difference.
|
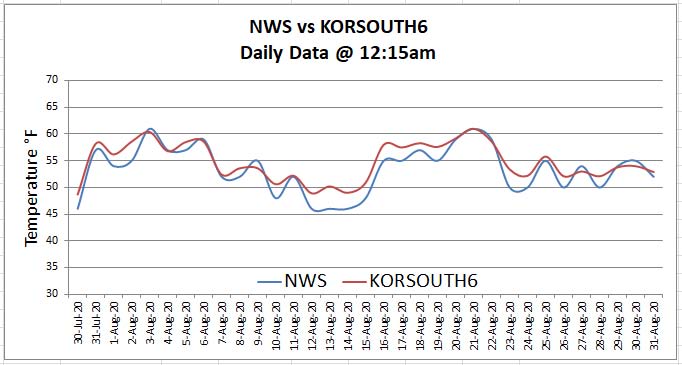
For the 12:15am quadrant, there was a 1°F average difference between KORSOUTH6 and NWS along with a 4°F maximum positive difference and a -1°F maximum negative difference.
|
|
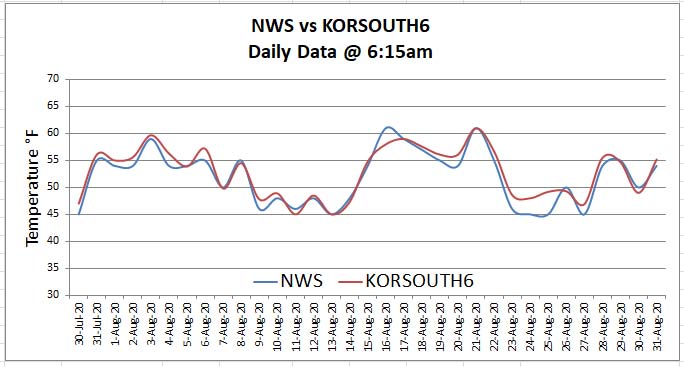
For the 6:15am quadrant, there was a 1°F average difference between KORSOUTH6 and NWS along with a 4°F maximum positive difference and a -3°F maximum negative difference.
|
|
For the 12:15pm quadrant, there was a 7°F average difference between KORSOUTH6 and NWS along with a 12°F maximum positive difference and a 0°F maximum negative difference.
|

|
For the 6:15pm quadrant, there was a 2°F average difference between KORSOUTH6 and NWS along with a 5°F maximum positive difference and a -2°F maximum negative difference.
|
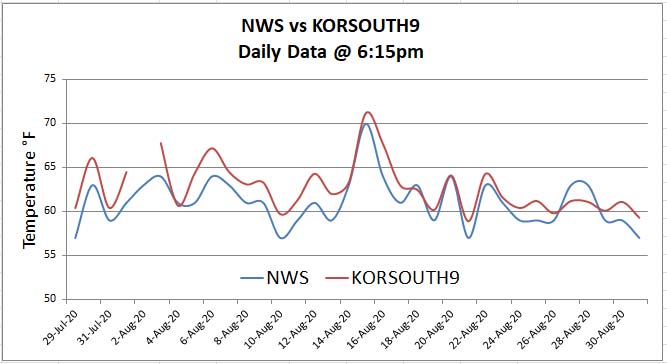
KORSOUTH9:
The following is a plot of the hourly data for each day.
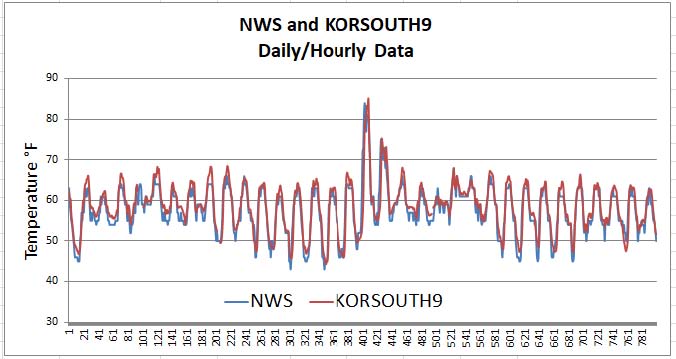
During this date range there was a 1°F average difference between the KORSOUTH9 station and the NWS station after the repair along with a 5°F maximum positive difference and a -17°F maximum negative difference.
|
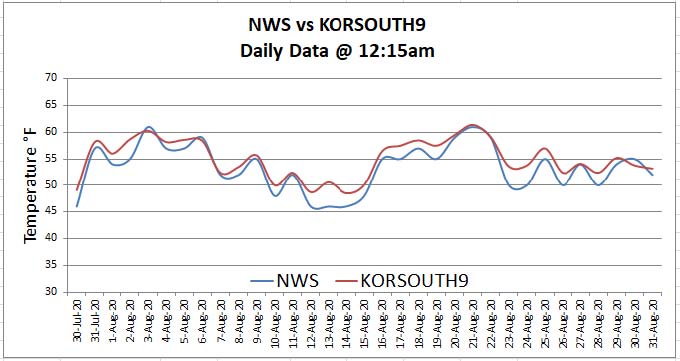
For the 12:15am quadrant, there was a 2°F average difference between KORSOUTH9 and NWS along with a 5°F maximum positive difference and a -1°F maximum negative difference.
|
|
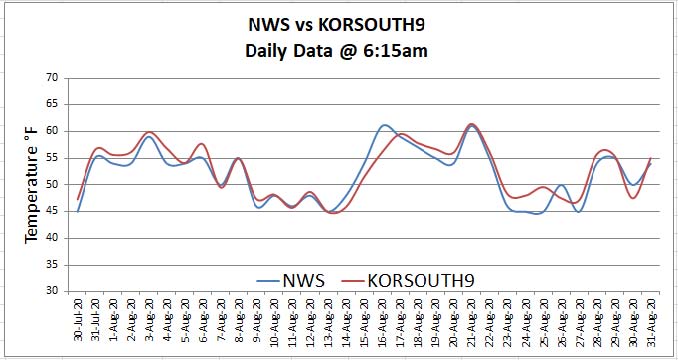
For the 6:15am quadrant, there was a 1°F average difference between KORSOUTH9 and NWS along with a 5°F maximum positive difference and a -5°F maximum negative difference.
|

|
For the 12:15pm quadrant, there was a 1°F average difference between KORSOUTH9 and NWS along with a 4°F maximum positive difference and a -1°F maximum negative difference.
|
|
For the 6:15pm quadrant, there was a 2°F average difference between KORSOUTH9 and NWS along with a 4°F maximum positive difference and a -2°F maximum negative difference.
|
15-AUG-2020:
On 15-August-2020, Oregon experienced an atypical above average temperature day. The noontime temperature in the Portland area reached 99°F. In South Beach, the temperatures started to rise quickly around 6:30am, reaching the peak around 11am, and stayed warm until about 8pm that evening. The following is a plot of the hourly data for 15-Aug-2020. NWS is represented by the thicker blue line in the chart.
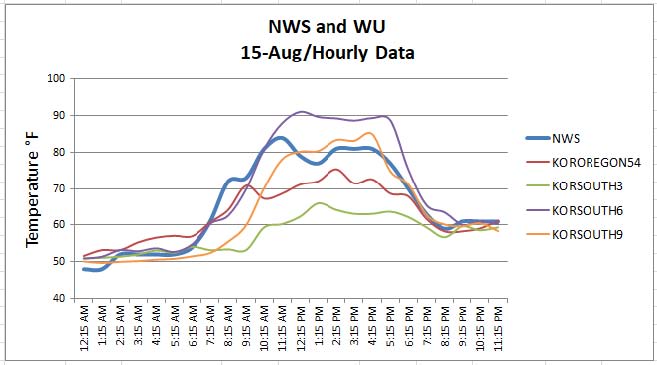
This chart dramatically shows the effects that location and other environmental factors have on a station’s performance. During the peak period NWS averaged around 80°F. To reiterate, the NWS sensors are on a flat, open field without surrounding trees or barriers.
On this day, I believe there was a NW onshore wind which generated a cooling layer near the coast. This could explain why KORSOUTH3 was on average some 15 degrees cooler than NWS. KORSOUTH3 is the lowest height of all the stations and overlooks the beach with no trees or barriers. The onshore breeze could have cooled the sensors. The KOROREGON54 station experienced a similar performance to KORSOUTH3 being exposed to the onshore breeze.
The KORSOUTH6 station averaged about 10 degree hotter than the NWS station (some 25 degrees hotter than KORSOUTH3). This station has the highest height of the all the stations and is surrounded by trees and a hill. But, the KORSOUTH6 sensor is mounted at roof level and was probably significantly affected by the warming radiation from the roof’s shingles.
The KORSOUTH9 station was within a few degrees of the NWS station except in the morning hours. This station is mounted on a pole in a big open yard but does have surrounding trees. This difference in morning temperature can be attributed to the tall, north trees on the property blocking the sun’s direct radiation on the sensor.
This particular chart most influenced my conclusion stated earlier in the paper.
Conclusion: Even though the WU stations are geographically close, each station’s geospatial location and other environmental factors showed that although the WU stations tracked the NWS station’s trend, the correlation was not that tight. Each station’s (NWS and WU) temperature recordings are relevant only unto itself.
-Rick Hallowell
-----------------------------------------------------------------------
References and Links
1: NWS - https://www.weather.gov/
2: Newport Municipal Airport - https://www.newportoregon.gov/dept/onp/
3: Weather Underground - https://www.wunderground.com/
4: Map of weather stations
5: Vaisala - https://www.vaisala.com/en
6: Davis Instruments Vantage Vue - https://www.davisinstruments.com/solution/vantage-vue/
7: Davis Instruments Vantage Pro2 - https://www.davisinstruments.com/solution/vantage-pro2/
8: Ambient Weather WS-2000 - https://www.ambientweather.com/amws2000.html
9: Weather Station Data
NWS - https://www.wrh.noaa.gov/mesowest/timeseries.php?sid=KONP
KOROREGON54 - https://www.wunderground.com/dashboard/pws/KOROREGO54
KORSOUTH3 - https://www.wunderground.com/dashboard/pws/KORSOUTH3
KORSOUTH6 - https://www.wunderground.com/dashboard/pws/KORSOUTH6
KORSOUTH9 - https://www.wunderground.com/dashboard/pws/KORSOUTH9